 Enterprise AI Platforms
Coefficient Review (2026): Live Operational Reporting in Spreadsheets
Reviewed and last updated: . Pricing checked against the vendor’s published plans at review time.
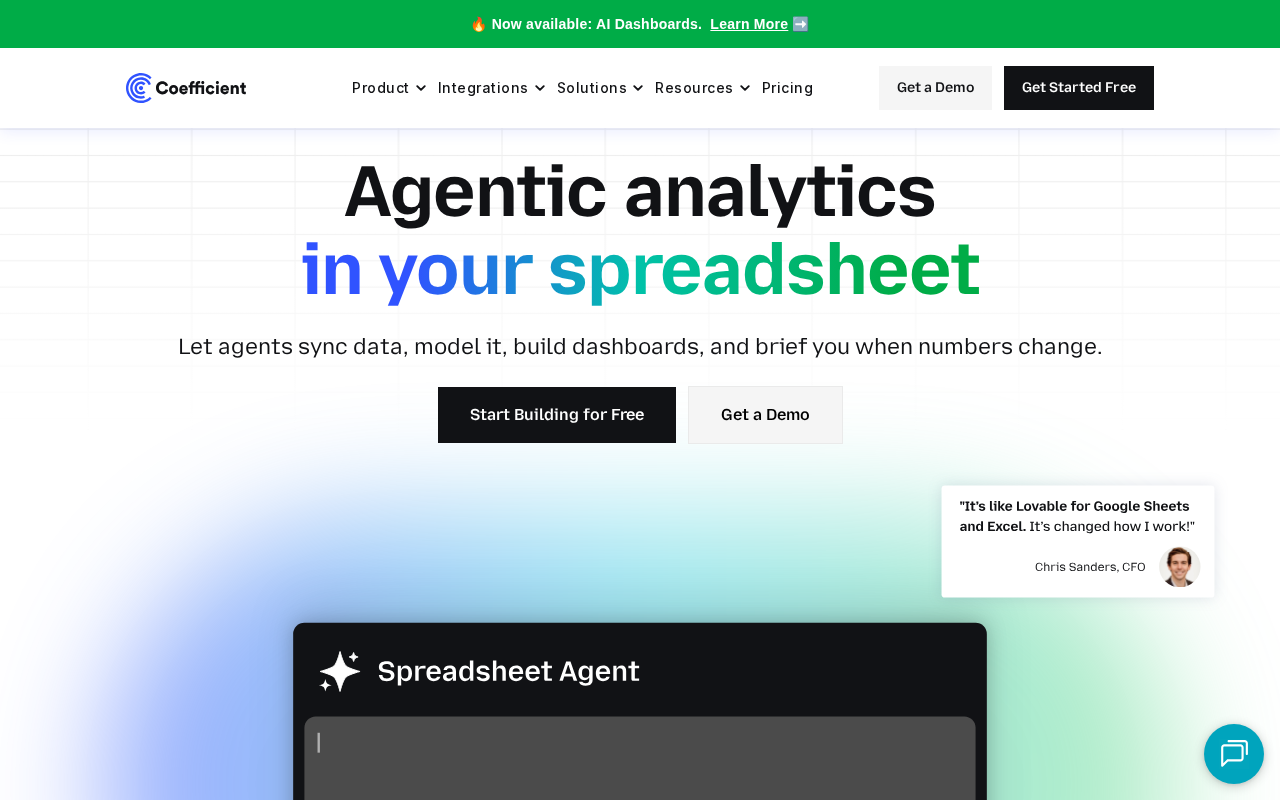
There’s a ritual in most finance and revops teams: export from the CRM, paste into the sheet, fix the formulas, send the report, repeat next week. Coefficient’s pitch is simple: keep the spreadsheet, kill the ritual.
What it does
It connects Google Sheets and Excel to live systems like CRMs, databases, and SaaS tools, refreshes the data on a schedule, alerts on changes, and can write back. The reports your teams already trust stay current on their own.
Why teams pick it
Because it meets them where they work. Nobody has to migrate to a heavier BI stack or relearn their workflow; the spreadsheet just stops lying about last month. Setup is fast enough that connecting a source and getting a live report is a same-day job, which makes it one of the quickest wins in this guide.
Where the limits are
Spreadsheet scale is still spreadsheet scale. For heavy modeling on large data, this complements a warehouse-and-BI setup rather than replacing it. And live data doesn’t cure report sprawl. Somebody still has to decide which reports deserve to exist.
When it makes sense
When spreadsheets are critical to how the business reports and decides, and staleness or inconsistency is causing real mistakes. Finance, analytics, and revenue operations usually own the decision.
Our take
The pragmatic pick for the reporting constraint. It fixes freshness where reporting actually happens today, not where a BI vendor wishes it happened.
What it costs
Coefficient’s published plans (as of August 2026): a usable Free tier (3 standard data sources, 5,000-row imports, 50 refreshes/month), Starter at $49/month (daily auto-refresh, 500 refreshes), and Pro at $99/user/month (hourly refresh, unlimited row sizes, up to 5 users) — with a custom Enterprise tier adding premium sources, SSO, admin controls, and unlimited refreshes. A 30-day Pro trial and ~17% annual discount are available. Per-user Pro pricing adds up; keep an eye on seat count versus an entry BI tool.
Pros and cons
Where it wins
- No migration: live data lands in the Sheets/Excel workflows teams already trust
- Scheduled refresh plus alerts kill the export-paste ritual
- Same-day setup; genuinely fast time-to-value
- Write-back support makes sheets an interface, not just a report
Where it hurts
- $99/user/month on Pro accumulates quickly across a team
- Spreadsheet scale limits remain; heavy modeling still wants a warehouse + BI
- Live data doesn’t cure report sprawl — governance stays on you
Alternatives to consider
Native connectors in Looker Studio or point tools like Supermetrics cover narrower marketing-data cases at lower cost. A full BI migration (Looker, Power BI, Tableau) is the heavyweight path Coefficient exists to postpone — often indefinitely for ops and finance teams.
Frequently asked questions
Is Coefficient worth it in 2026?
If your business runs on spreadsheets that keep going stale, yes: it’s our core pick for live reporting and the fastest win in this guide. If you’re already deep in a governed BI stack, it’s a complement, not a need.
What does Coefficient cost?
Free tier with limited sources and refreshes; Starter $49/month; Pro $99/user/month (up to 5 users) with hourly refresh and unlimited rows; Enterprise is custom with SSO and premium sources. A 30-day Pro trial is available.
Does Coefficient replace a BI tool?
No — it makes the spreadsheet layer live and trustworthy. For complex modeling on large data you’ll still want a warehouse and BI stack; Coefficient’s job is stopping the daily export-paste cycle where reporting actually happens.
Transparency: EnterpriseAI.app may receive referral revenue if you sign up through links on this page, at no additional cost to you. Evaluations are completed before referral relationships are considered — see our methodology and disclosure.